Monitor App Usage
This page shows how to build an Appsmith app to monitor other Appsmith applications by fetching audit logs and displaying data.
Prerequisites
- Appsmith instance with access to Admin setting.
- Access to the MongoDB URI, either embedded with Appsmith or external.
Fetch usage data
Follow these steps to connect your MongoDB and create queries to fetch usage data:
-
Open the Admin Settings, click the settings icon in the top-right corner of your workspace. If the icon is not visible, ensure you are signed in with an administrator account.
-
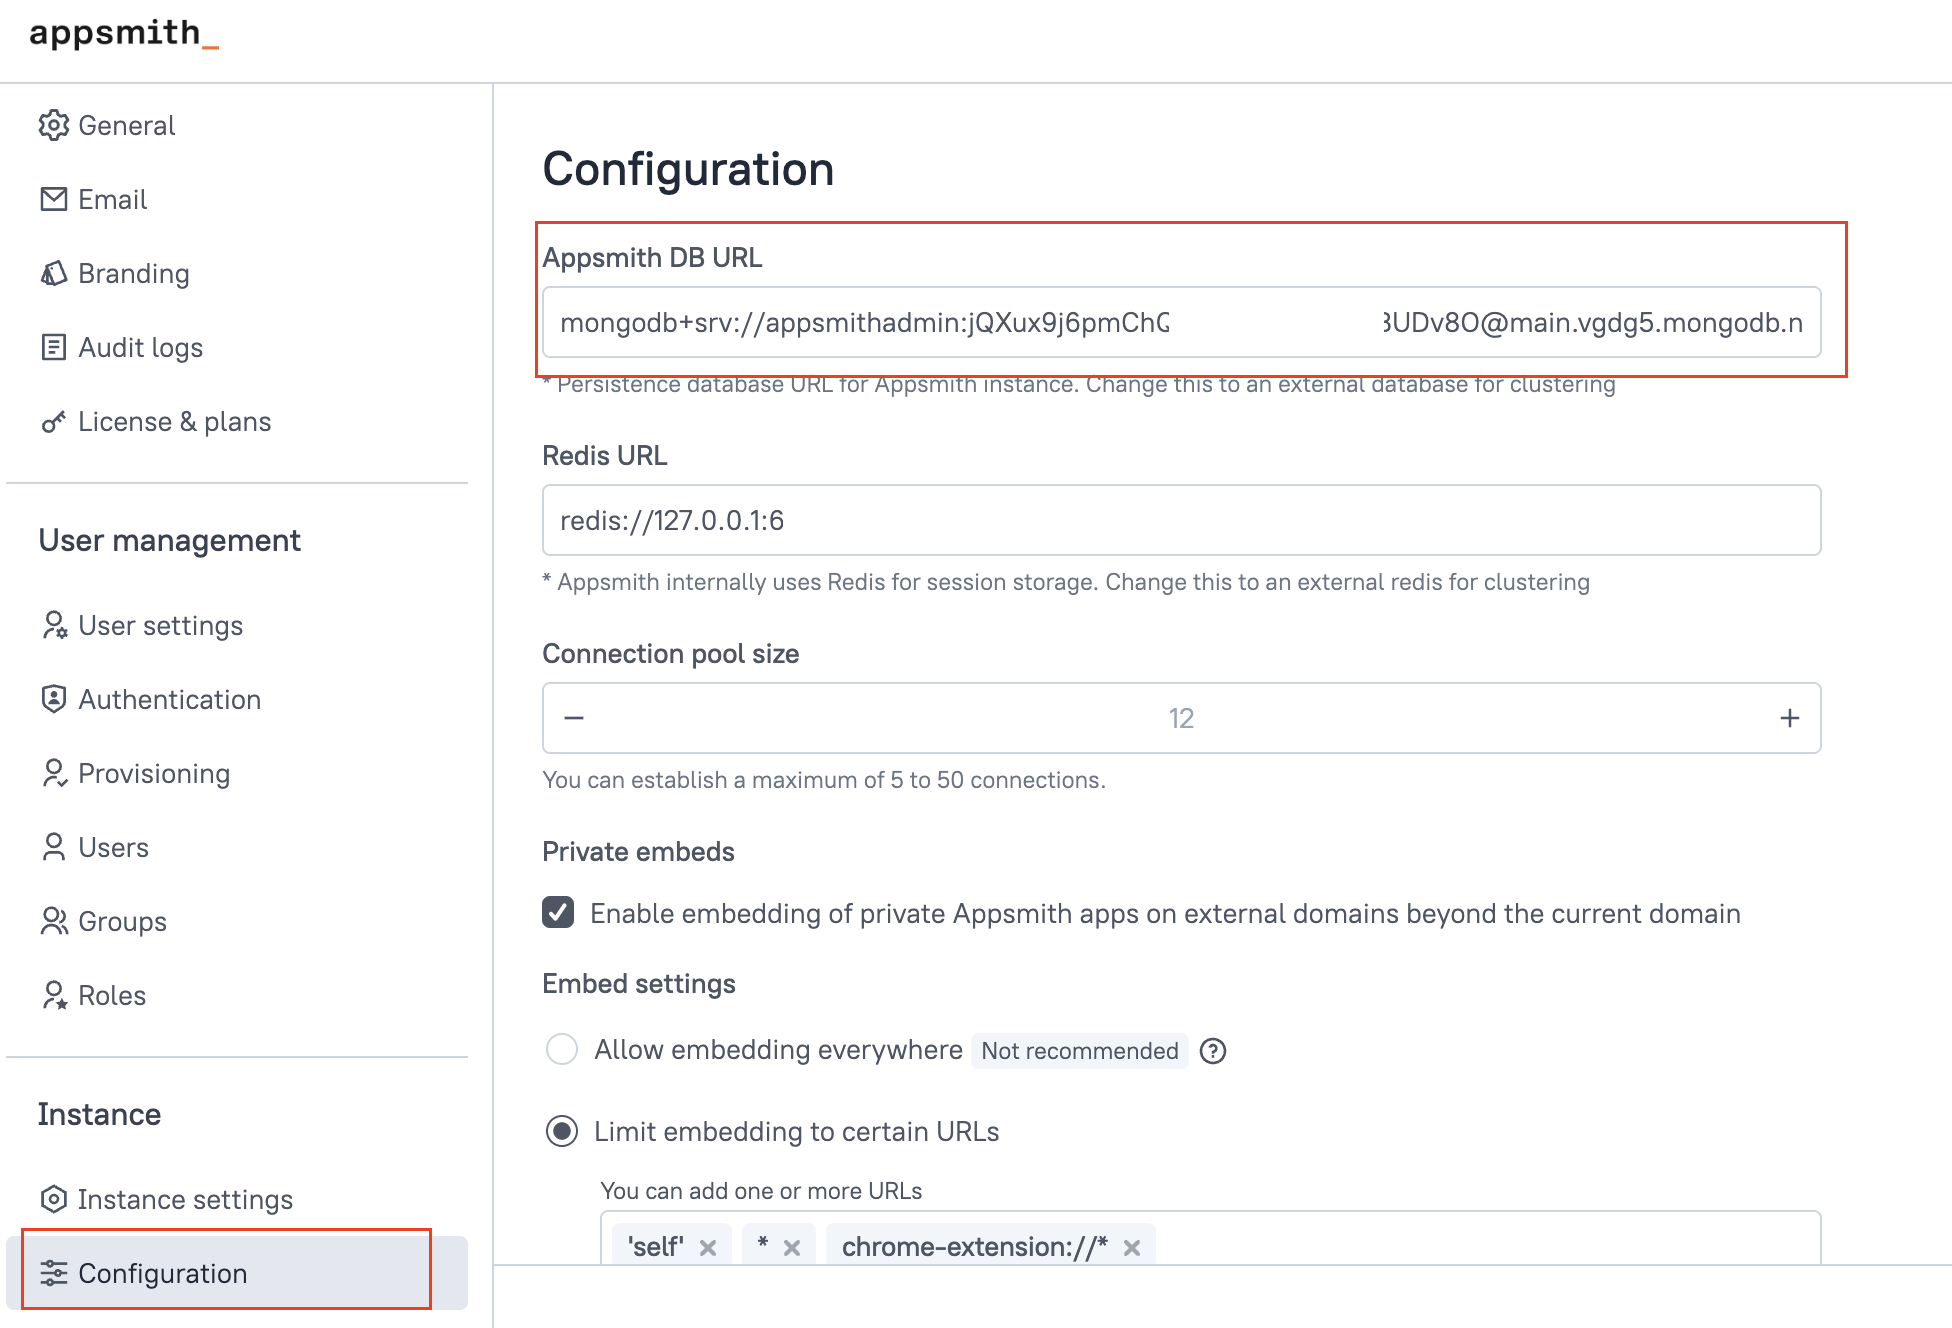
In Admin Settings, go to the Configuration section and copy the value of
APPSMITH_DB_URL.
If the URI is not visible, open your environment file (docker.env for Docker or values.yaml for Kubernetes) and copy the value of APPSMITH_DB_URL.
mongodb://appsmith:Oabc123@localhost:27017/appsmith
- Open your Appsmith application and navigate to the Datasource section. Click + Create New and select MongoDB.
- For external MongoDB, use the provided URI or configure it according to your MongoDB setup.
mongodb+srv://username:password@cluster.mongodb.net/appsmith
- For embedded MongoDB (internal), append
?authsource=appsmithto the end of the URI, like this:
mongodb://appsmith:Oabc123@localhost:27017/appsmith?authsource=appsmith
For more information on how to configure the MongoDB datasource, see MongoDB.
- Create a new query using the connected MongoDB datasource. Select the
auditlogcollection to retrieve event data from your Appsmith instance.
You can configure the query using filters to track specific types of activity such as:
-
For application lifecycle events, use
application.created,application.updated,application.deleted, andapplication.deployedto track when applications are created, modified, deleted, or deployed. -
To keep track of user actions, use
user.logged_in,user.logged_out, anduser.signed_upto log user sign-ins, sign-outs, and new user registrations. -
To track page activities, use
page.created,page.viewed,page.updated, andpage.deletedto monitor new page creation, views, edits, and deletions.
For more information on how logs are stored, see Log contents.
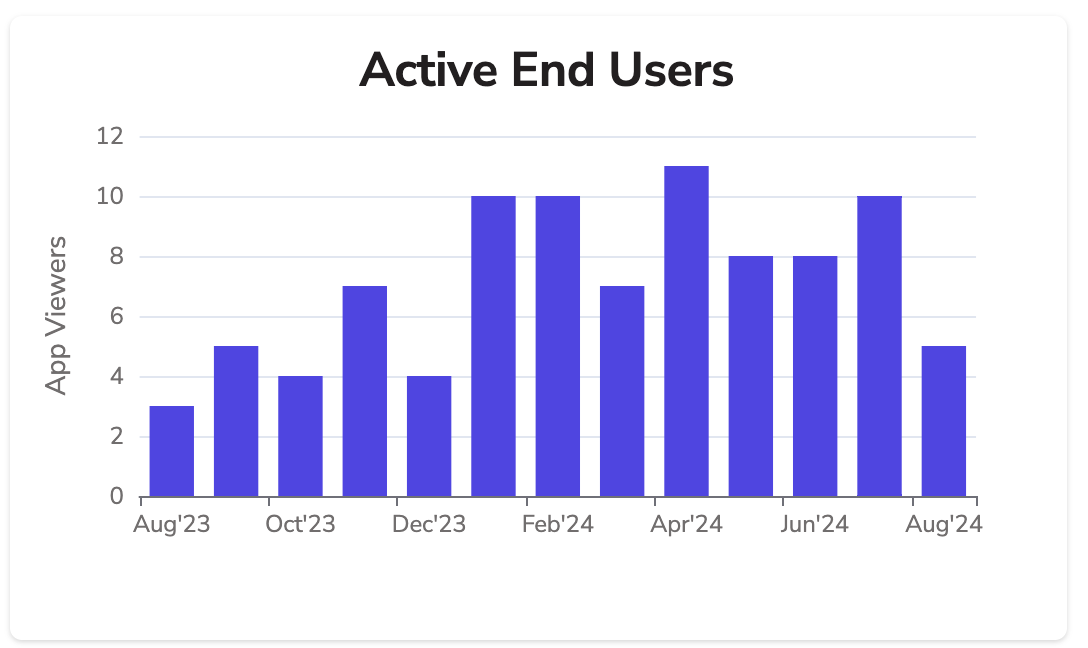
Example: To display the number of active end users per month on a Chart widget, set the Command as Aggregate and configure the query as shown below:
// This query counts the number of unique active users per month and year, excluding anonymous users, and sorts the results by date.
[
  {
    $match: {
      "application.mode": "view", // Only include records where the application is in view mode
      "user.email": {
        "$not": {
          "$regex": "anonymousUser", // Exclude records with anonymous users
          "$options": "i" // Case-insensitive matching
        }
      }
    }
  },
  {
    $group: {
      _id: {
        month: { $month: { $toDate: "$timestamp" } }, // Extract month from timestamp
        year: { $year: { $toDate: "$timestamp" } } // Extract year from timestamp
      },
      uniqueUsers: { $addToSet: "$user.email" } // Group by unique user emails
    }
  },
  {
    $project: {
      _id: 0,
      month: "$_id.month",
      year: "$_id.year",
      count: { $size: "$uniqueUsers" } // Count the number of unique users
    }
  },
  {
    $sort: { year: 1, month: 1 } // Sort results by year and month in ascending order
  }
]
- Drag a Chart widget and set its Series Data property to display the data, like:
{{getAppViewersByMonth.data.map((item) => ({ x: Utils.formatDate(item), y: item.count }))}}
Sample App
- Usage Overview: Get platform activity for the last 30 days.
- Monthly Usage: A page that shows detailed app usage for the month.
- Raw Logs: A page that displays raw logs in a tabular format.